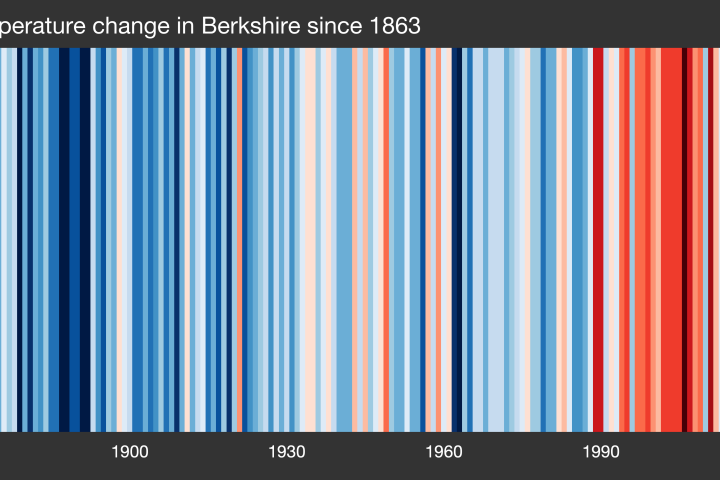
New climate stripes for Berkshire and cities and countries all over the world have been launched to mark Earth Day (Wednesday, 22 April).
The updated graphics, which now include an additional stripe to represent temperatures from 2025, show the rapid impact that global warming is having on individual nations and regions. In January, the global climate stripes graphic was updated to add a dark red stripe to represent the global temperature in 2025 – Earth’s third warmest year on record.
The release comes as people all over the world get ready to share the graphics for #ShowYourStripesDay on Friday, 20 June 2026.
Professor Ed Hawkins, the University of Reading scientist who created the climate stripes, said: “Earth Day is a moment to stop and think about the planet we want to live on. A planet with clean air, clean water, stable seasons and thriving wildlife. That is what we are fighting for, and it is still within reach.
“Every new stripe shows how fast the world is heating up. Rapid warming means more floods, more droughts, more wildfires and more disruption to the food and water that billions of people depend on.
“What happens next rests on the choices we make now and in the future. Sharing the climate stripes with friends, family and colleagues starts the vital everyday conversations we need to have about how we should all respond to these challenges. The
time for action is now.”
The climate stripes show the change in average annual global temperatures since 1850. Red stripes indicate hotter years and blue stripes indicate cooler years, against the average of the period 1961-2010.
More than 1,000 cities, countries and regions now have their own bespoke climate stripes. The graphics were updated using the latest data from Berkeley Earth.
Stripes images for individual cities, countries and continents can be viewed at showyourstripes.info. Post the graphics on social media using #ShowYourStripes on Friday, 20 June, or use them however you like on any other day of the year, to start climate conversations.