
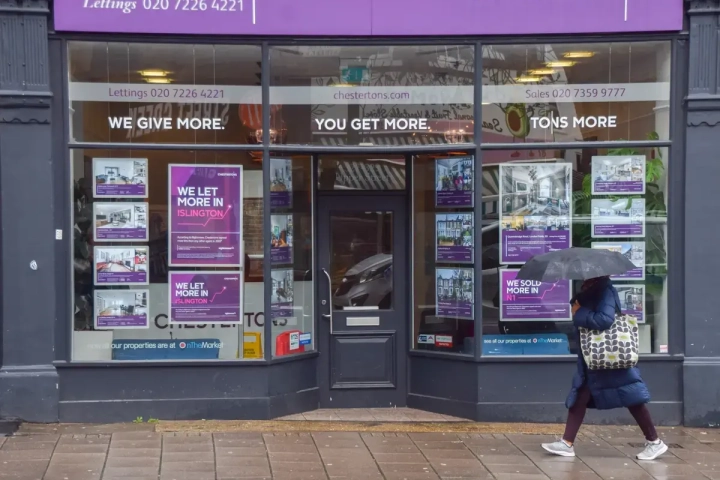
Property prices are rising much faster in some parts of the UK than others, with the gap between the strongest and weakest local markets now stretching to more than 17 percentage points.
To see where buyers are pushing prices up most, HIPPO compared residential sales across 359 local authorities in England, Scotland, Wales, and Northern Ireland.
The areas are ranked by the change in their average property price between 2024 and 2025, with sales, turnover, existing-home prices, and three-year growth also considered to give a clearer view of what is happening in each market.
The UK’s 10 most in-demand property hotspots
| Rank | Area | Nation | Average price 2024 | Average price 2025 | Price growth | Three-year price growth | Sales per 1,000 dwellings | Sales in 2025 |
| 1 | Oldham | England | £189,411 | £208,072 | 9.85% | 16.68% | 25.50 | 2,526 |
| 2 | Blackburn with Darwen | England | £145,113 | £159,329 | 9.80% | 16.30% | 30.59 | 1,959 |
| 3 | Melton | England | £262,496 | £287,436 | 9.50% | 7.39% | 40.14 | 1,008 |
| 4 | Derry City and Strabane | Northern Ireland | £158,889 | £173,420 | 9.15% | 19.99% | 22.32 | 1,479 |
| 5 | Fermanagh and Omagh | Northern Ireland | £170,861 | £185,024 | 8.29% | 19.44% | 19.06 | 975 |
| 6 | Newry, Mourne and Down | Northern Ireland | £189,168 | £204,240 | 7.97% | 16.75% | 23.26 | 1,746 |
| 7 | Burnley | England | £117,728 | £127,050 | 7.92% | 8.35% | 32.56 | 1,403 |
| 8 | Liverpool | England | £164,404 | £177,221 | 7.80% | 11.18% | 20.72 | 5,011 |
| 9 | Orkney Islands | Scotland | £202,037 | £217,534 | 7.67% | 6.69% | 26.87 | 318 |
| 10 | Halton | England | £174,780 | £188,148 | 7.65% | 12.30% | 26.22 | 1,554 |
Oldham leads the ranking, though only just. Its average property price has climbed by 9.85%, from £189,411 to £208,072, putting £18,661 on the cost of a typical home. Prices are also up by 16.68% over three years.
Close behind is Blackburn with Darwen, where a 9.80% rise takes the average to £159,329. It is still one of the cheaper places in the top 10, alongside Burnley, which comes seventh with an average of £127,050 following growth of 7.92%.
Melton is third and has the biggest cash increase in the top 10. Buyers are paying £24,940 more than the year before, a 9.50% increase, taking the average to £287,436. Homes move more frequently here too, with 40.14 sales per 1,000 dwellings, compared with 25.50 in Oldham.
Northern Ireland takes all three places from fourth to sixth. Prices are up by 9.15% in Derry City andStrabane, 8.29% in Fermanagh and Omagh, and 7.97% in Newry, Mourne and Down. The longer-term figures are even stronger: all three have seen growth of more than 16% since 2022, led by Derry City and Strabane at 19.99%.
Burnley is seventh and the cheapest area in the top 10. Its average price rose by 7.92%, or £9,322, to reach £127,050. The local market was also busier than most of the areas above it, with 32.56 sales per 1,000 dwellings.
Liverpool comes eighth after prices rose by 7.80%, or £12,817, to £177,221. It is easily the largest sales market in the top 10, with 5,011 homes changing hands, although that works out at a fairly low 20.72 sales for every 1,000 dwellings.
Scotland’s only entry is the Orkney Islands in ninth. The average price there has reached £217,534 after a 7.67% rise, based on 318 sales. Halton finishes the top 10 with growth of 7.65%, adding £13,368 to the average and taking it to £188,148.
The UK areas where property prices fell the most
| Rank | Area | Nation | Average price 2024 | Average price 2025 | Price change | Three-year change | Sales per 1,000 dwellings | Sales in 2025 |
| 1 | Cotswold | England | £451,284 | £418,192 | -7.33% | -2.70% | 30.85 | 1,427 |
| 2 | City of Westminster | England | £1,082,168 | £1,024,448 | -5.33% | -11.35% | 15.96 | 2,111 |
| 3 | Newham | England | £428,872 | £410,256 | -4.34% | -2.30% | 15.67 | 2,079 |
| 4 | Na h-Eileanan Siar | Scotland | £143,203 | £137,764 | -3.80% | -4.73% | 22.94 | 350 |
| 5 | City of Aberdeen | Scotland | £143,583 | £138,261 | -3.71% | -8.94% | 38.87 | 4,891 |
| 6 | Hammersmith and Fulham | England | £819,058 | £793,894 | -3.07% | -1.01% | 23.52 | 2,237 |
| 7 | Winchester | England | £475,251 | £461,268 | -2.94% | -3.24% | 31.05 | 1,825 |
| 8 | Eastbourne | England | £265,562 | £257,899 | -2.89% | -7.39% | 32.42 | 1,617 |
| 9 | Hastings | England | £252,825 | £245,766 | -2.79% | -8.75% | 30.02 | 1,338 |
| 10 | South Hams | England | £382,826 | £373,714 | -2.38% | -3.84% | 33.36 | 1,596 |
Cotswold sits at the bottom after the average sale price fell by £33,092 in a year. Homes now sell for £418,192 on average, down 7.33%. Prices for existing properties followed much the same path, falling by 7.40%.
Westminster has seen a smaller percentage drop, at 5.33%, but the biggest loss in cash terms. Its average is down by £57,720 to just over £1.02 million. Prices are also 11.35% lower than three years ago, and relatively few homes are changing hands.
Newham is next, with prices falling by 4.34% to £410,256. It has the lowest turnover rate anywhere in the study, with just 15.67 sales per 1,000 homes.
Two Scottish areas follow. In Na h-Eileanan Siar, the average has dropped by 3.80% to £137,764, based on only 350 sales. Aberdeen is almost the same price at £138,261 after a 3.71% fall, but the market there is much busier. It recorded 4,891 transactions and ranks 15th in the UK for turnover.
Hammersmith and Fulham comes sixth from bottom, losing £25,164 from its average price. Homes still cost £793,894, but that is 3.07% less than the year before. Winchester follows after a 2.94% drop takes its average to £461,268.
Eastbourne and Hastings sit side by side near the bottom. Prices have fallen by 2.89% in Eastbourneand 2.79% in Hastings, leaving averages of £257,899 and £245,766 respectively. Hastings has seen the steeper fall over three years, at 8.75%.
South Hams completes the bottom 10. Its average price is down by £9,112 to £373,714, a fall of 2.38%. Sales have held up better than in most of the areas around it, though, with 33.36 homes sold per 1,000 dwellings.
Commenting on the findings, Gareth Lloyd Jones, Managing Director at HIPPO, said: “A lot of the places near the top are still comparatively affordable, and that is likely to be part of what is pulling buyers in. If someone cannot get the space they need in their first-choice location, looking a little further away can suddenly put a bigger home or a garden within reach.
“It is worth remembering that rising prices do not always mean homes are selling constantly. Oldham has the strongest price growth, but it is much further down the table for turnover. Aberdeen is the other way around: lots of homes are changing hands, but prices have fallen. The two things do not always go together.
“When people find a property they really want, especially somewhere homes are going quickly, there can be a rush to get the offer in and worry about the rest later. That is understandable, but the clear-out after completion is one cost that often gets forgotten.
“Ask the seller what they are actually taking with them, and have a proper look in the loft, shed, garage, and garden. Old carpets, broken furniture, leftover building materials, and things stored in outbuildings can turn into quite a big job once the keys are handed over.
“For sellers, dealing with that clutter before the photographs and viewings is usually worth doing. Rooms look bigger, buyers can see the space properly, and there is less to deal with during an already stressful moving week.
“If prices are falling locally, I would also be careful about spending a lot on renovations just because you plan to sell. Finish the obvious jobs and make the property feel looked after, but speak to a local agent before replacing a kitchen or bathroom. You may not get that money back.”